Clara Cheung / Work
02 / 05

Bibligraph

Bringing scattered sources into a connected view of the Bible.

Why I started

Data archives recording people, places, and events in the Bible can vary in their naming, descriptions, identities, and relationships.

What I built

A shared data structure and visual interface for searching, following connections, and opening the passages and sources that support them.

What it enables

A working exploration tool that brings more than 5,400 entities and 20,000 evidence claims into one coherent graph. It also creates a foundation for improved search, tagging, and agentic usage.
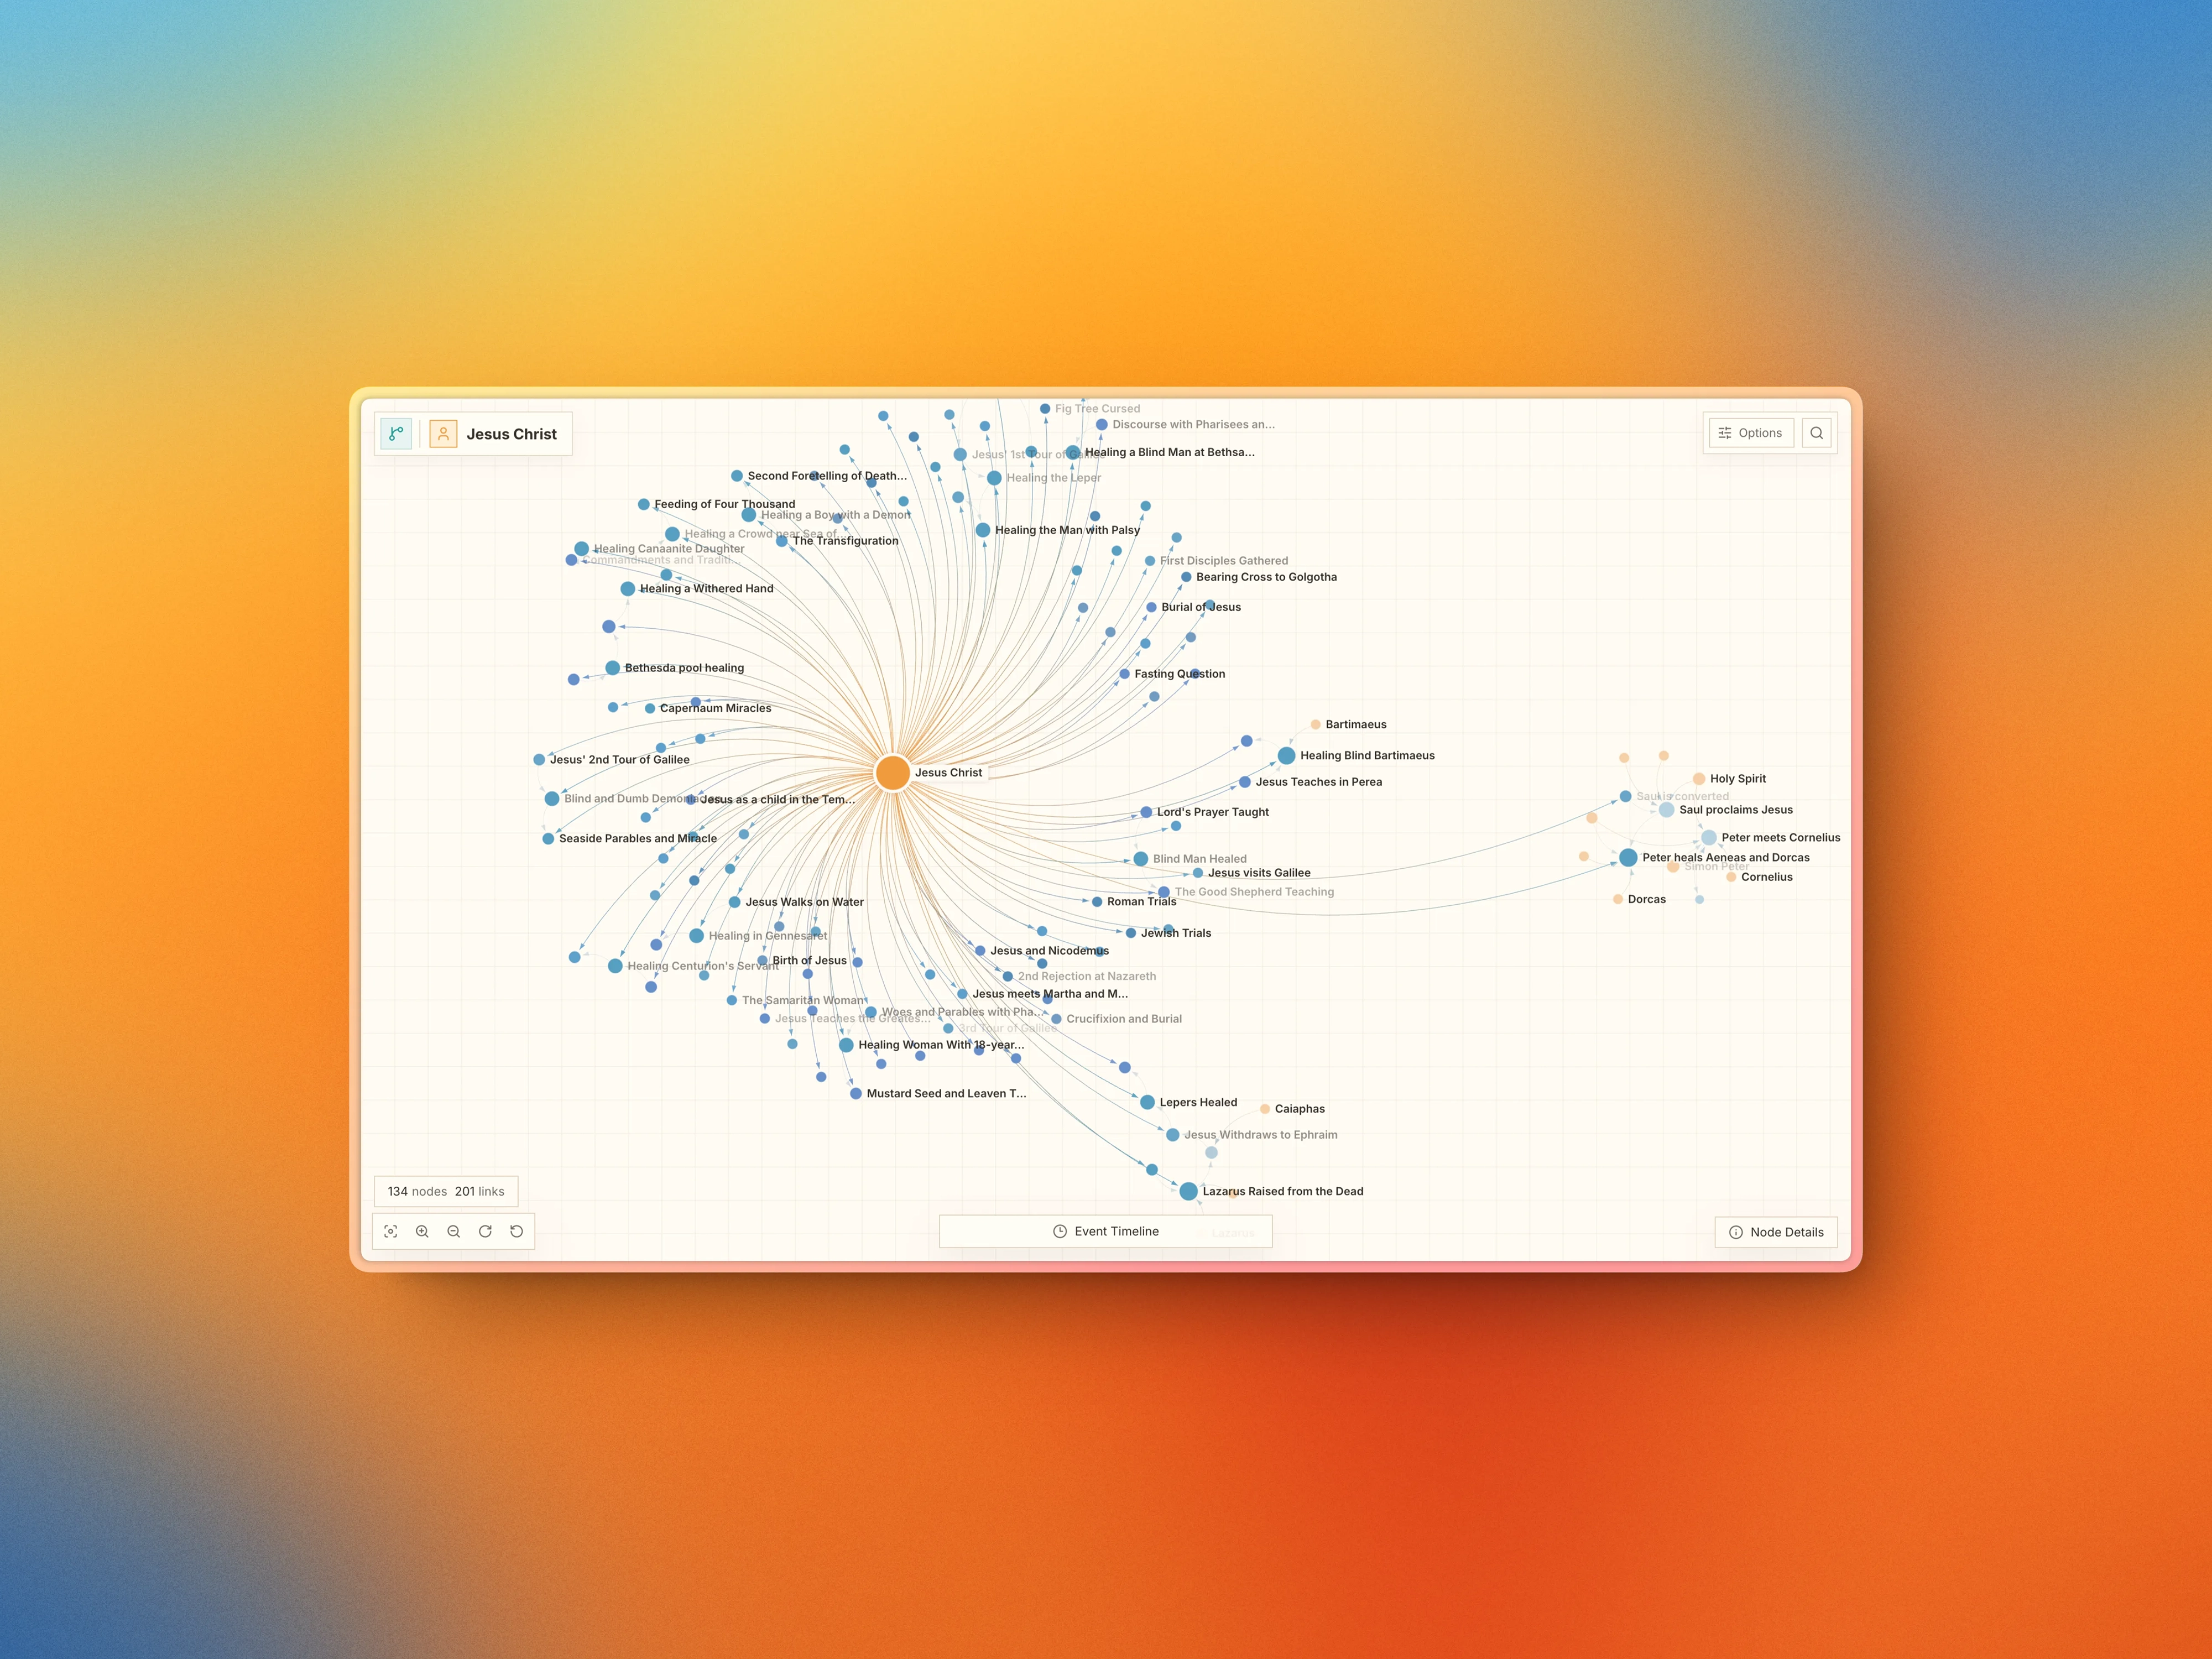
Bibligraph graph exploration interface showing events and people connected to Jesus Christ.
Bibligraph · Connected graph workspaceFig. 01

My role and motivation

I directed and built the project independently, utilizing tools across research, design, and implementation. This is one of my favourite projects because it combines data modeling with a visual way to explore knowledge. I wanted the sources to work together as a coherent structure while keeping their differences visible when they matter to the reader.

View live Bibligraph ↗

How I approached it

  1. Connect the sources

    Bring datasets such as Theographic, STEPBible, and OpenBible into a shared model of entities, relationships, and evidence.

  2. Resolve ambiguity

    Distinguish people with the same name, reconcile overlapping records, and record decisions so corrections survive future updates.

  3. Design around exploration

    Start with a question or person, follow a connection, then open the relevant passage and sources when needed.

  4. Check the meaning

    Test whether search results and explanations preserve the subject, direction, and evidence behind each relationship.

The working graph

5,445

Entities in one shared structure

People, places, events, and other concepts in the September 2026 build.

7,350

Relationships to explore

Connections that support navigation across the text.

20,134

Evidence claims

Records kept alongside their sources for inspection and review.

A decision that shaped the interface

  • I chose to make the graph the starting point and bring in evidence on demand. Readers can explore without facing all the source-management complexity at once.

  • An association can be useful for discovery without proving an answer. The interface and data rules preserve that distinction.

What testing revealed

  • One audit found that following a relationship backwards could reverse its meaning in the explanation, even though the stored data was correct.

  • I corrected how direction and subjects were handled and added checks for evidence at each step. It was a useful reminder to test the meaning people receive, as well as the underlying data.

Where this could lead

I’m interested in how relational knowledge could improve search, give agents better context, and eventually support more granular translation work. Those are directions to investigate, built on the structure developed here.